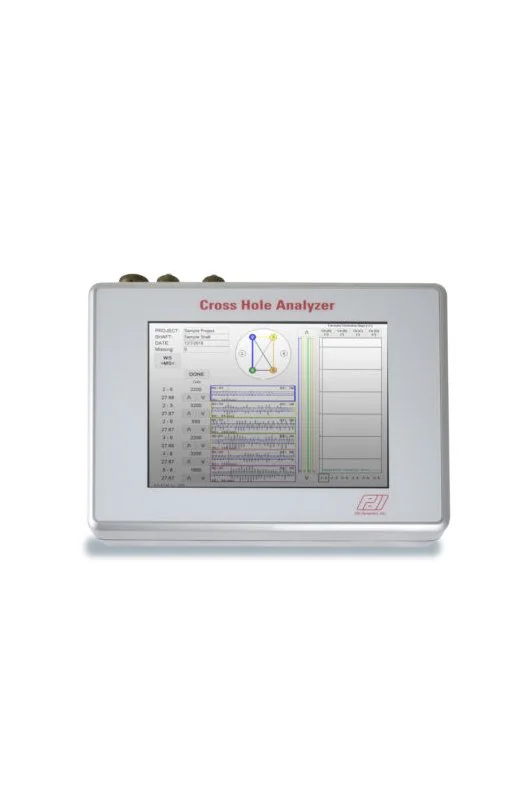
Cross Hole Analyzer (CHAMP Q)
Evaluation of concrete quality in deep foundations by the Crosshole Sonic Logging method (CSL)
Allows for four probes (six profiles) to be pulled at once for ease and efficiency of data collection
Allows for four probes (six profiles) to be pulled at once for ease and efficiency of data collection
Allows for four probes (six profiles) to be pulled at once for ease and efficiency of data collection
Available in a 2-channel or a 4-channel system
Offers PDI-TOMO, 3-D tomographic software for superior tomographic results of questionable areas
DESCRIPTION
The Cross Hole Analyzer determines the quality and consistency of the concrete of drilled shafts, slurry walls, bored piles, cast-in-situ piles, and other types of concrete foundations. PDI’s Cross Hole Analyzer (CHAMP-Q) is ideal for testing four probes (six profiles) in just one pull, saving time and money. CHAMP-Q has color-coded wires for easy identification of probe receiving/transmitting. The CHAMP-Q meets or exceeds the specifications of ASTM D6760 and several other crosshole sonic logging codes and standards.
Test the entire shaft with CHAMP-Q
Once a shaft is prepared with PVC or steel tubes during construction, transceivers are lowered into the access tubes and probe one will transmit a high-frequency signal that travels through the concrete and is detected by the other probes which are acting as receivers. This action is repeated with the other probes being automatically configured as transmitters sequentially allowing up to six profiles to be scanned with a single pull. As these sensors are raised and/or lowered along the length of the foundation, the CHAMP-Q displays and records the strength of the received signal, as well as the time from signal emission to signal arrival as a function of depth.
In CSL testing, scanning various tube combinations for the entire shaft allows evaluation of concrete quality and defect location along the length and by quadrant. With the CHAMP-Q, the user can pull four cables at once, each color-coded for easy identification, and via a newly designed, space-efficient tripod.
The CHAMP-Q Main Unit is portable, light, and rugged featuring:
Fast and accurate field measurements
Large sunlight-readable color LCD touchscreen that is highly visible in all lighting conditions.
Optimized data entry for real-time analysis onsite (waterfall diagram)
Replaceable battery and USB ports for quick and easy data transfer
CHAMP’s CHA-W Data Processing Software provides powerful tools for data analysis such as:
Ability to simultaneously review six data profiles
History mapping of already collected data
First Arrival Time (FAT) detection
Easy defect identification
Two methods of signal strength evaluation (energy or amplitude)
CHA-W reporting tools comprise user-customized graphs and tables:
Sonic Map – Signal strength versus time and depth in the traditional waterfall diagram
First Arrival Time – Signal travel time from transmitter to receiver, versus depth
Wave-speed Plot – Wave-speed (an indicator of concrete strength) versus depth
Wave–speed Table – Wave-speeds, means, and standard deviations
Energy or Amplitude Plot – Signal strength versus depth
Defect location graphically (horizontal red line) and in table format
Visit the PDI Website for more information.

